Here are some notes on the crazy figures seen recently for my Electric, since the recent changes with the cap etc:
| Before Oct 1st 2022 | After Oct 1st 2022 | |
| Rough weekly cost | £10.00 | £100.00 |
As you can see above, the cost has gone up, per week, roughly from ten pounds per week, to one hundred pounds per week…!
But the crazy thing is that £700 was automatically added to the meter just after the start of October. So I have not been topping up the Electric at all. I have just been watching it go down + down.
Here it is on 6.10.22: (£699.67)

And here is my meter tonight (18.10.22) (£500.27)

Which is about £200 over 2 weeks.
Note: I have had a notification letter from SSE of the increase in the rates I will be paying, but there were nothing like this. And obviously these prices are not sustainable at all! One other thing is that I have noticed that SSE is now “OVO” (on my bank statements etc).
Also, I did get an SMS message from SSE to say to ignore the strange figures etc for a while. But that is a bit non-specific (i.e. which figures do I ignore? until when etc?)
I want to keep this simple, so I am just looking for someone to explain what is going on here. I mainly need to know that my rough weekly electric bill is not going to be £100 per week!!!
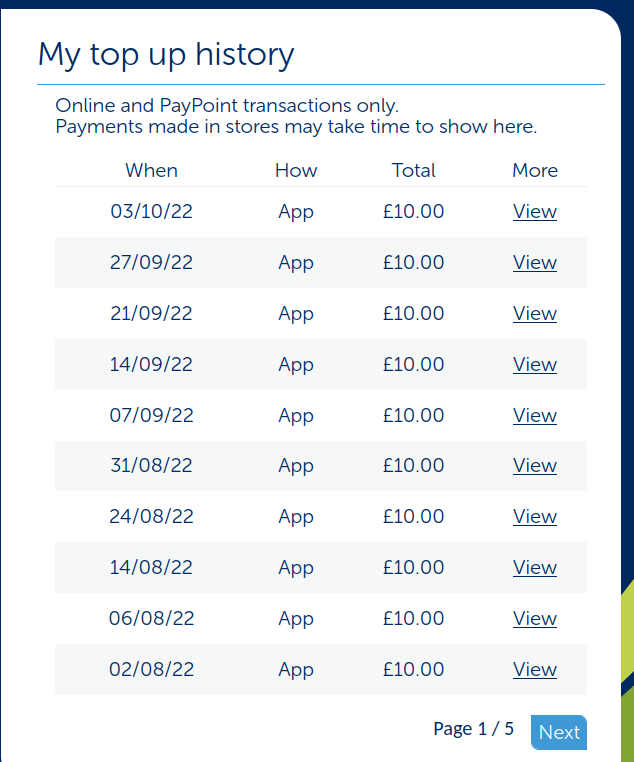
UPDATE: Here are my Electric payments from before October 2022. You can see they are roughly £10:00 per week (ten pounds per week):
Below is an edited version of the above notes, changed so it is readable on the “online form” on the SSE website: https://sse.co.uk/forms/general-enquiry/about
Hello SSE
Here are some notes on the crazy figures seen recently for my Electric, since the recent changes with the cap etc:
Rough weekly cost : –
Before Oct 1st 2022 = £10.00
After Oct 1st 2022 = £100.00
As you can see above, the cost has gone up, per week, roughly from ten pounds per week, to one hundred pounds per week…!
But the crazy thing is that £700 was automatically added to the meter just after the start of October. So I have not been topping up the Electric at all. I have just been watching it go down + down.
Here is the credit level on 6.10.22: (£699.67)
And here is my credit level tonight (18.10.22) (£500.27)
Which is about £200 over roughly 2 weeks.
Note: I have had a notification letter from SSE of the increase in the rates I will be paying, but the increases described were nothing like this. And obviously these prices are not sustainable at all! One other thing is that I have noticed that SSE is now “OVO” (on my bank statements etc).
Also, I did get an SMS message from SSE to say to ignore the strange figures etc for a while. But that is a bit non-specific (i.e. which figures do I ignore? until when etc?)
I want to keep this simple, so I am just looking for someone to explain what is going on here. I mainly need to know that my rough weekly electric bill is not going to be £100 per week!!!
Many thanks
UPDATE: when I try to send a message as above, I am getting the below:
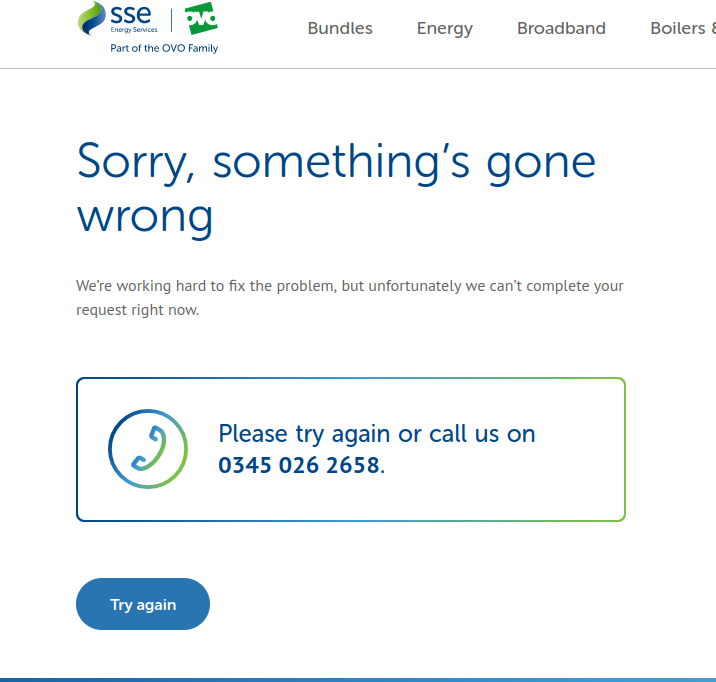 Hmm….
Hmm….
UPDATE: I’ve sent an actual email to:
HomeServicesComplaints@sseenergyservices.com
listed at
https://sse.co.uk/help/home-services/making-a-complaint
UPDATE: Thursday 27th October 2022
Added a reply to someone on a post I made on a Facebook group, as below:
“Hiya, I actually received a very nice phone call from SSE yesterday, after I sent an email to them. They explained that the crazy numbers I’ve been seeing on the “In Home Display” are certainly a glitch. If I really need to see my real balance/usage, I could look at the actual meter under the cupboard, so to speak.
Link to FB group post:
https://www.facebook.com/groups/704526854043856/permalink/861633948333145/